International Journal of Anatomical Sciences 2014, 5(1):01-10
Research Paper
Morphometric Analysis of Nitrergic and Cholinergic Neurons of Myenteric Plexus of Enteric Nervous System of Rat Colon In Chronic Stress
Rashmoni Jana, Ahamadulla Shariff, Tapas K Das.
Department of Anatomy, All India Institute of Medical Sciences, New Delhi, India.
Key words: Atrophy, Colon, Dismotility, Morphometry, Passive Avoidance Stress
Abstract: Stress is a response of the organism which alters the homeostasis. Role of chronic stress in the modulation of common gastrointestinal disorders has already been established. Long lasting stress affects the synaptic plasticity, dendritic morphology and neurogenesis. The present study was conducted to evaluate the morphological changes in the enteric nervous system of rat colon to understand the basis of functional and physiological alterations in response to chronic stress. Seven male wistar rats were subjected to chronic passive avoidance stress for 6 hours daily for 42 days and they were compared with equal number of controls. Colonic tissue was collected for histochemistry of nitrergic and cholinergic neurons of myenteric plexus of enteric nervous system and evaluated both by light and electron microscope. The number and size of the neurons were evaluated. The area, perimeter and maximum diameter or ferret diameter were measured according to the principles of stereology for neuronal profile. There was atrophy of both nitrergic and cholinergic neurons as well as reduction in number in the myenteric plexus in rat colon. There were bouts of diarrhoea followed by constipation in the stressed animals. Psychological stress is known to cause oxidative stress to the cells, which damages the DNA structure leading to cell death. Thus apoptosis could be responsible for reduction of neuronal cell population and size. The dismotility may be due to imbalance between inhibitory (nitrergic) and excitatory (cholinergic) neurons due to their atrophy.
Stress is a defensive response of the organism to various stimuli (psychological, chemical or physical), that may alter the homeostasis of the organism (Chrousos GP and Gold PW 1992; McEwen BS 2000). Psychological stresses have always been acknowledged as potential harm to health like chronic disorders of the digestive system including functional gastrointestinal disorders (FGD), inflammatory bowel diseases (IBD), gastro-esophageal reflux (GERD) and peptic ulcer disease (PUD) (Brandspiegel HZ 1998; Wittstein IS 2005). Several literatures have indicated that long lasting stress affects the synaptic plasticity, dendritic morphology, and neurogenesis in animals and humans (Kim JJ and Yoon KS 1998; Sapolsky RM 1996). The stress system is activated when homeostasis is challenged by extrinsic or intrinsic forces. The digestive tract is unique among internal organs because it is exposed to a large number of physio – chemical stimuli and certain stressful life events have been associated with the onset or exacerbation of some of the most common chronic disorders of the digestive system as mentioned above. There is sufficient literature describing the physiological and functional changes of gut due to different types of stressors. The present study has attempted to evaluate the morphological changes, if any, that occur in the gut wall and the enteric nervous system of the colon, with a view to understand the basis of functional and physiological alterations.
Materials and Methods
All procedures were explained and approved by the Animal Ethics Committee, All India Institute of Medical Sciences, New Delhi.
Total fourteen male Wistar rats weighing 150 to 200 gm and aged 6 to 10 weeks were included and devided as control and experimental group (n=7). All the rats were kept in animal house providing separate cage for each rat maintaining 12:12 hour dark/light cycle. Appropriate humidity and temperature were maintained with food and water ad libitum to both experimental and control except the period from 10.00 am to 4.00 pm.
Stress Protocol
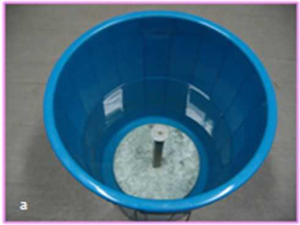
The experimental group of animals was subjected to passive avoidance stress as per the protocol described by Enck, P et al in 1989 for 6 hours daily for a period of 42 days (Enck P et al. 1989). Each experimental rat was made to sit on a small platform (diameter 4 cm) elevated one inch above the water level in a barrel partially filled with water (Figs. 1a, b). After experiment they were returned to their home cages and provided with food and water. The controls were also kept in the same room and not given any food (except water) while the experimental animals were undergoing stress. Body weight was recorded before and 42 days after the experiment of both groups. Number of faecal pellets was also counted (Fig.1b).
| Fig. 1 Photographs represent sress model | (a) and Rat is in a stress model (b). White arrow indicates the number of fecal pellets (b) |
|
|
Tissue collection and Processing
At the end of the experiment, animals were anaesthetized by ether inhalation and perfused with 4% buffered paraformaldehide. Whole colon was identified and taken 2-3 cm away from the caecum. The lumen was cleaned gently with 0.1 M phosphate buffer. Sections were stained by Cresyl violet and Masson’s trichrome. Cryosections were stained by NADPH Diaphorase and Acetyle choline esterase (AChE). All sections were examined under light and electron microscopes.
Morphometry and application of stereology
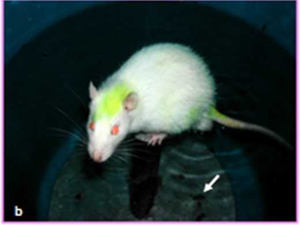
The images were analysed using ImageJ (available at http://rsb.info.nih.gov/ ij/). The myenteric neurons, plexuses and nitrergic & cholinergic neurons were identified and accurately outlined and measured for the cell profiles like area, perimeter and ferret diameter and mean point count for neurons (Figs. 2a, 2b).
| Fig. 2 Photographs represent outlines of neuron used for stereological analysis | Nissle stain (a) and NADPH stain (b) |

|
|
STATISTICAL ANALYSIS
STATA software was used for statistical analysis and data was expressed as mean ± standard deviation. Independent sample t test (Student’s t-test) was used to determine the statistical significance between the means. Standard error of mean (SEM) and the 95% confidence interval (CI) of the difference between the means were noted. Probability levels of less than or equal to 5 % (two-tailed p value < 0.05) were considered to be significant.
Observations
It was noticed that the respiratory rate and the movements of the whiskers were increased when the animals were going through stress period. Initially the fecal out-put was increased in experimental animal during both stress and non stressed period. Later it was noticed that there was alternate diarrhoea and reduced excretion (constipation). Towards the end of the phase of stress period the fecal excretion was decreased. There was no alternate diarrhoea and constipation in the control animals. It was noticed that the food intake reduced by the experimental than control animals.
Observation of Body weight & adrenal gland weight
The net body weight gain in experimental group was lesser than the control as food intake was less in former group.
Relative weight of adrenal gland
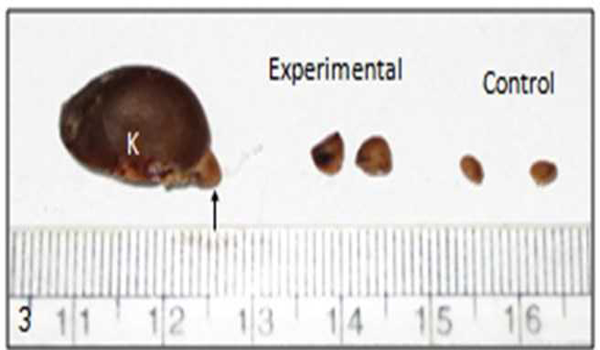
The relative weight of adrenal gland was expressed as: adrenal weight in mg × 100 per unit body weight in gm (Table 1). In experimental animal relative weight of adrenal gland was increased (p = 0.035) than the control (Fig. 3). In chronic stress there was hypertrophy of adrenal glands.
| Table 1. Relative adrenal gland weight to the body weight in experimental (E) and control (C) Rat | |||
| Animal no | Adrenal weight (mg) | Body weight (gm) | Relative adrenal wt to body wt |
| C1 | 0.020940 | 170 | 0.0123221 |
| C2 | 0.032019 | 225 | 0.0142310 |
| C3 | 0.037830 | 250 | 0.015132 |
| C4 | 0.026293 | 230 | 0.0114321 |
| C5 | 0.032697 | 225 | 0.0145321 |
| C6 | 0.039471 | 245 | 0.0161110 |
| C7 | 0.039372 | 234 | 0.0145179 |
| E1 | 0.028600 | 195 | 0.0146670 |
| E2 | 0.034400 | 180 | 0.0191111 |
| E3 | 0.035400 | 195 | 0.0181538 |
| E4 | 0.028000 | 150 | 0.0186667 |
| E5 | 0.025900 | 195 | 0.0132821 |
| E6 | 0.027000 | 150 | 0.0180000 |
| E7 | 0.029800 | 165 | 0.0180606 |
Table shows increased relative adrenal gland weight to the body weight in experimental (E) than control (C) rat. Mean relative adrenal gland weight to body weight in control is 0.0139 and in experimental group is 0.0169. (t=-2.442 & p=0.035*).
| Fig. 3 Kidney with adrenal gland indicated with arrow and shows hypertrophy of adrenal gland in chronic stress. (K = kidney) |
 |
Morphometry in (Cresyl violet) Nissl stained sections
The size of the myenteric ganglia was reduced in experimental animal (Fig. 4). In control the mean point count of myenteric ganglia was 15.19 (SD 12.61, min 0, max 66) and in experimental it was 13.96 (SD 12.37, min 0, max 57). The mean point count of neuronal cells in the myenteric plexus of control rat was 6.56 (SD 6.10, min 0, max 32). In experimental animals it was diminished to 4.85 (SD 4.97, min 0, max 29) (Figure 4). The myenteric ganglia (t=0.17 and p= 0.85) and the myenteric neurons (t=0.53 and p= 0.60) were reduced in chronically stressed rat.
The mean area and perimeter of the neuronal profiles of myenteric neuronal cell in cresyl violet stained sections were compared. The mean ± SD area in non-stressed or control animal was 26.4 ± 21.91 μ2 (median 21.42 μ2, min 7.56 μ2, max 268.3 μ2). In stressed rat it was 21.4 ± 11.93 μ2 (median 18.38 μ2, min 3.66 μ2, max 130.01 μ2). Perimeter of the myenteric neuron in control was 22.01 ± 6.94 μ (median 20.53 μ, min 11.58 μ, max 71.44 μ). In the experimental it was 18.02 ± 4.83 μ (median17.11 μ, min 7.84 μ, max41.73 μ). The overall size of neuronal cell profiles i.e.area (t=0.49 & p= 0.63) and perimeter (t=1.16 & p=0.27) in myenteric ganglion is reduced after chronic stress (Table 2).
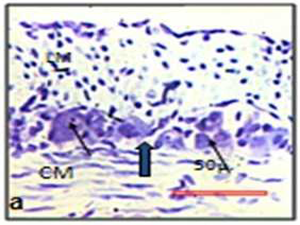
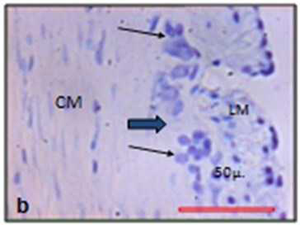
| Fig.4 Myenteric ganglia in Cresyl violet stain. | |
|
|
| Black arrows indicate the neuron. Thick black arrow indicates the myenteric ganglion. Control (a) and experimental (b). (LM = Outer longitudinal muscle; CM = Inner circular muscle) | |
Morphometry of diaphorase positive neurons
The mean area of neuronal somata of nitrergic myenteric neurons was 274.51± 116.41 μ2 (median 262.65 μ2, min 71.79 μ2, max 948.05 μ2) in control, where as that of the experimental animals was 191.43±94.67 μ2 (median 168.32 μ2; min 29.48 μ2; max 739.31 μ2) . The perimeter of the neuronal soma was 65.26± 14.7 μ (median 64.27 μ; min 34.11 μ; max 127.36 μ) in the control group and in experimental animal it was 54.95 μ ± 13.79 μ (median 53.44 μ; min 22.61 μ; max 108.45 μ) (Figure 5). The ferret diameter of neuronal soma in control was 24.25± 5.76 μ (median 23.79 μ; min 11.58 μ; max 48.26 μ). In chronic stressed rat it was 20.87± 5.72 μ (median 20.37 μ, min 7.64 μ, max 41.02 μ). There is a decrease in the mean area (t=1.357 & p=0.204), perimeter (t=1.258 & p=0.236) and ferret diameter (t=1.063 & p=0.312) of the myenteric nitrergic neurons in stressed rats compared to the control animals.
The mean point counts of nitrergic neurons in myenteric ganglion in colon was reduced in experimental animals (mean ± SD) 4436.67 ± 2665.16, (median 3850, min 1200, max 10400) compared to the control (mean ± SD) 11369.23 ± 6438.62; (median10800, min 3200, max 30500). The number of nitrergic (inhibitory) neurons of myenteric ganglion was significantly (t=-2.436 & p=0.03*) reduced in chronic stress (Fig. 5) (Table 2).
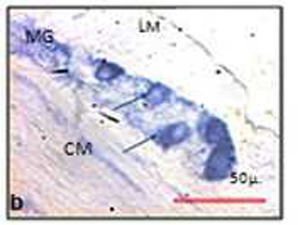
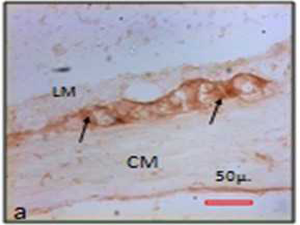
| Fig.5 Myenteric ganglion in NADPH – diaphorase stain. | |

|
|
| Note the decreased size of the NO (nitric oxide) positive neurons in chronic stressed rat (b) than control (a). Black arrows indicate the neurons and unstained area is nucleus (LM = Outer longitudinal muscle; CM = Inner circular muscle; MG = Myenteric ganglia) | |
Morphometry of the cholinergic myenteric neurons
Morphometric evaluation of the Acetyle choline esterase (AChE) positive neuronal cells in the myenteric ganglion was also performed. The mean area of cholinergic neurons in the myenteric ganglion was 272:27 ± 122:18 μ2 (median 250:85 μ2; min 72:71 μ2; max 791:59 μ2) in the control and in the experimental animals it was 224:63 ± 114:02 μ2 (median 199:15 μ2; min 47:98 μ2; max 730:04 μ2).
| Fig.5 Myenteric ganglion in NADPH – diaphorase stain. | |
|

|
| Note the decreased size of the NO (nitric oxide) positive neurons in chronic stressed rat (b) than control (a). Black arrows indicate the neurons and unstained area is nucleus (LM = Outer longitudinal muscle; CM = Inner circular muscle; MG = Myenteric ganglia) | |
The mean area (t=0.698 & p=0.50) of cholinergic neurons was reduced in chronically stressed rats. The mean perimeter of the cell profiles in control animals was 62:91 ± 14:01 μ (median 61:42 μ; min 33:85 μ; max 113:22 μ) and in experimental it was 58:21± 15:11 μ (median 56:79 μ; min 28:59 μ; max 126:99 μ). The mean ferret diameter of neuronal profiles in the control group was 24:04 ± 5:91 μ (median 23:18 μ; min 12:42 μ; max 45:86 μ) and in the experimental it was 22:59 ± 6:47μ (median 22:09 μ; min 10:75 μ; max 53:25 μ). The perimeter (t=0.55 & p=0.58) and ferret diameter (t=0.40 & p=0.69) of the myenteric neuronal profiles in the myenteric ganglion was also reduced in experimental animal colon. It has been noted that excitatory cholinergic neurons also atrophied in chronic stress (Fig. 6) (Table 2).
| Table 2: Comparisons of different neuronal cell profiles of myenteric plexus in different types of neurons | ||||
| Staining procedure | Section in | (Mean) Cell profiles | Experimental | controls |
| Cresyl violet | Paraffin sections | point count of myenteric ganglia | 13.96 | 15.19 |
| point count of neuronal cells in the myenteric plexus | 4.85 | 6.56 | ||
| area | 21.4 ± 11.93 μ2 | 26.4 ± 21.91 μ2 | ||
| Perimeter | 18.02 ± 4.83 μ | 22.01 ± 6.94 μ | ||
| Nitrergic myenteric neurons (NADPH) positive | Cryosections | point counts of nitrergic neurons in myenteric ganglion | 4436.67 ± 2665.16, | 11369.23 ± 6438.62 |
| area | 191.43±94.67 μ2 | 274.51± 116.41 μ2 | ||
| Perimeter | 54.95 μ ± 13.79 μ | 65.26± 14.7 μ | ||
| ferret diameter | 20.87± 5.72 μ | 24.25± 5.76 μ | ||
| Cholinergic myenteric neurons (AChE) positive | Cryosections | area | 224:63 ± 114:02 μ2 | 272:27 ± 122:18 μ2 |
| Perimeter | 58:21± 15:11 μ | 62:91 ± 14:01 μ | ||
| ferret diameter | 22:59 ± 6:47μ | 24:04 ± 5:91 μ | ||
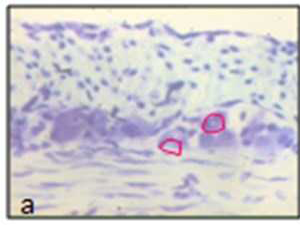
Electron microscopy
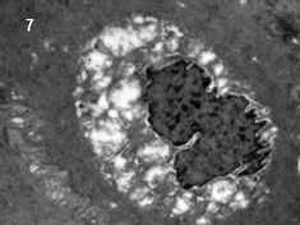
In electron microscopy it was noted that the number of mast cells was increased in experimental animal. The microvillus architecture of epithelium was distorted in stressed colon. The numbers of apoptotic cells in the colon of experimental animal were more than those in the control animals (Fig. 7).
Discussion
There are numerous reports on the functional disturbances of the gastrointestinal system in stress, but the literature is scant on the structural changes in the enteric nervous system of rat colon after chronic stress. An appreciation of these changes is required for understanding of the disturbances of the GI system. Hence this study was undertaken to evaluate the effects of chronic stress on the morphology of the enteric nervous system in the rat colon. Chronic passive water avoidance stress has already been used to study the stress-induced changes of gastrointestinal function (Enck P et al 1989). We have adopted same model but studied morphometric changes as well of chronic stress on the enteric nervous system.
| Fig. 7 Electron microscopic picture of an apoptotic cell. | |
|
|
The enteric nervous system is connected bi-directionally to the brain via autonomic pathways forming the brain-gut axis (Bhatia V and Tandon RK 2005). The myenteric plexus is mainly concerned with motor activity of muscularis externa (Berezina TP and Ovsiannikov VI 2011; Ovsiannikov VI and Berezina TP 2007), and the submucous plexus with various activities of mucosa of the gut wall. It is evident that the different kinds of stress with different amplitudes have profound role in motor activity, secretion, permeability and immunological functions of the gut wall (Caso JR et al. 2008). As these functions are coordinated by the ENS, it is likely that stress directly or indirectly affects the Enteric Nervous System via HPA axis and its neurotransmitters (Monnikes H et al. 1994). Corticotropin releasing factor (CRF) is reported to be the key mediator of the central stress responses (Suto G et al.1994; Takeda E et al. 2004). Two CRF receptor subtypes, R1 and R2, have been described which mediate increased colonic motor activity and delayed gastric emptying, respectively, in response to stress. The weight of the adrenal gland relative to the body weight (p<0.035) was increased (Table 2) in the animals subjected to chronic stress. There is an increase in CRH which results in hypertrophy of the adrenal gland. The relative weight of adrenal gland to body weight is a better marker than the blood levels of corticosterone in rats as it tends to return to basal levels in chronic stress (Yvonne M and Ulrich-Lai 2006). During the initial phase of the experiment the animals subjected to passive avoidance stress exhibited anxiety and tried to escape from the situation. After a few days their food intake was reduced. Takeda E et al reported that stress induces loss of appetite due to anorectic effects of CRF and delayed gastric emptying (Takeda E et al. 2004). There was diarrhea in stressed animals due to increased colonic motor activity during the initial phase of the experiment. Delayed gastric emptying and increased colonic motility were reported in both animals and humans under stressful conditions (Da Silva MS et al. 2002; Gue M et al. 1991; Tache Y et al. 1999). Multiple neurotransmitters play active role in the propulsion of the bolus from oral to aboral direction in the intestines. The progressive aborally directed peristaltic movement of the bolus is effected by a net balance between excitatory cholinergic and inhibitory nitrergic neurons. The muscle wall of the intestine contracts behind the bolus under the influence of the excitatory cholinergic neurons and a receptive relaxation of the wall occurs in front of the bolus by diffusing NO (nitric oxide) produced by the nitrergic neurons. The ring of contraction behind the bolus migrates aborally propelling the bolus behind the distal wave of relaxation.
The morphology of both the cholinergic and nitrergic neuronal categories was evaluated following exposure of the animals to chronic stress in our study. In the current study chronic stress resulted in the atrophy of the myenteric neurons of the enteric nervous system as shown by a reduction of neuronal cell size in myenteric plexus (Figs. 2, 3). In these animals there was a reduction of nitrergic neuronal size in the experimental group (Fig. 2). The atrophy of nitrergic neurons was responsible for constipation after a bout of diarrhoea due to the delay in the relaxation of the bowel after contraction. Chronic stress had profound effect on the myenteric cholinergic neurons. The size of the excitatory cholinergic neurons in the myenteric plexus was reduced (decreased area, perimeter and diameter of the neuronal profiles) in stressed animals (Fig. 3). Magarinos, AM et al (1996), McEwen, B.S. et al (1999) and Czeh, B et al (2001) have shown that stress had profound effects in neuronal morphology and function in several forebrain systems including limbic structures and the prefrontal cortex. Studies in animal models of chronic stress and stress hormones have demonstrated stress induced atrophy in CA3 pyramidal neurons, decrease in adult neurogenesis in the dentate gyrus and reduction of total hippocampal volume. It has been proposed by Jacobson, L. et al (1991) that these morphological changes might interfere with the negative regulation of the stress response that is induced by the hippocampus via the hypothalamic-pituitary-adrenal axis. More recently it has been shown that in rat the amygdala and prefrontal cortex are also morphologically affected by stress (Wellman CL 2001 and Wittert GA et al. 1996). Mechanisms similar to those implied in these reports may well be responsible for the atrophy and apoptosis of the neurons of the ENS as they closely resemble the neurons of the CNS, rather than the neurons of the peripheral nervous system, in their structural characteristics and neurotransmitter.
Conclusion
It was known that chronic stress leads to physiological disturbances like adrenal hyperplasia, anorexia, gastric stasis, increased colonic motility and inflammation, diarrhoea and/or constipation and reduction of body weight consequently. In the present study it is demonstrated that chronic passive avoidance stress causes atrophy and reduction in the numbers of cholinergic as well as nitrergic myenteric neurons in the rat colon. The apoptosis could be responsible for reduced neuronal cell population and atrophy. The mechanisms responsible for these changes are likely to be similar to those operating in the CNS in stress. However, they need to be investigated and confirmed by ultra structural and molecular biological techniques with large number of sample.
Acknowledgement
The authors would like to thank Prof T S Roy (Department of Anatomy, AIIMS, New Delhi) for his help towards writing the manuscript
Declaration
No conflicts of interest, financial or otherwise, are declared by the author(s). This project work was supported by institute research fund.
References
Berezina TP, Ovsiannikov VI (2011) Changes of contractile activity of the colon under psychogenic stress before and after blockade of M – and N-cholinergic and beta-adrenoceptors. Ross Fiziol Zh Im I M Sechenova, 97:72-82.
Jones FW (1953) Buchanans manual of anatomy 8th
edition. Literary Licensing. 584-590.
Bhatia V, Tandon RK (2005) Stress and the gastrointestinal tract. J Gastroenterol Hepatol, 20:332-339.
Grant JCB (1958) The method of anatomy descriptive and deductive. 6th edition. Oxford University Press, London, UK. 424-427.
Brandspiegel HZ, Marinchak RA, Rials SJ, et al., (1998) A broken heart. Circulation, 98:1349.
Sinnatamby CS (1999) Last’s Anatomy, 10th Edition.
Churchill Livingstone, London, UK. 114–115.
Caso JR, Leza JC, Menchén L (2008) The effects of physical and psychological stress on the gastro-intestinal tract: lessons from animal models. Curr Mol Med, 8:299-312.
Chrousos GP, Gold PW (1992) The concepts of stress and stress system disorders. Overview of physical and behavioral homeostasis. JAMA, 267:1244-1252.
Czeh B, Michaelis T, Watanabe J, et al., (2001) Stress-induced changes in cerebral metabolites, hippocampal volume, and cell proliferation are prevented by antidepressant treatment with tianeptine. Proc Natl Acad Sci U S A, 98:12796-12801.
Da Silva MS, Zimmerman PM, Meguid MM, et al.,(2002) Anorexia in space and possible etiologies: an overview. Nutrition, 18:805-813.
Enck P, Weinbeck M, Erckenbrecht JE (1989) Nerves and the GastrointestinalTract, chapter Stress- induced changes of gastrointestinal transit in the rat, pages 753-757. MTP Press Limited, Kluver Academic Publishers Group.
Gue M, Junien JL, Bueno L (1991) Conditioned emotional response in rats enhances colonic motility through the central release of corticotropin-releasing factor. Gastroenterology, 100:964-970
Jacobson L, Sapolsky R (1991) The role of the hippocampus in feedback regulation of the hypothalamic-pituitary-adrenocortical axis. Endocr Rev, 12:118-134.
Kim JJ, Yoon KS (1998) Stress: metaplastic effects in the hippocampus. Trends Neuroscience, 21:505-509.
Magarinos AM, McEwen BS, Flugge G, et al.,(1996) Chronic psychosocial stress causes apical dendritic atrophy of hippocampal CA3 pyramidal neurons in subordinate tree shrews. J Neurosci, 16:3534-3540.
McEwen BS (2000) Allostasis and allostatic load: implications for neuropsychopharmacology. Neuropsychopharmacolog, 22:108-124.
McEwen BS (1999) Stress and hippocampal plasticity. Annu Rev Neurosci, 22:105-122.
Monnikes H, Schmidt BG, Tebbe J, et al., (1994) Microinfusion of corticotropin releasing factor into the locus coeruleus/subcoeruleus nuclei stimulates colonic motor function in rats. Brain Res, 644:101-108.
Ovsiannikov VI, Berezina TP (2007) Contractile activity of duodenum, jejunum, and ileum at psychogenic stress in rabbits before and after muscarinic or nicotinic cholinoceptor blockade RossFiziolZhImI MSechenova, 93:1263-1274.
Sapolsky RM (1996) stress is bad for your brain. Science, 273:749-750.
Suto G, Kiraly A, Tache Y (1994) Interleukin 1 beta inhibits gastric emptying in rats: mediation through prostaglandin and corticotropinreleasing factor. Gastroenterology, 106:1568-1575.
Tache Y, Martinez V, Million M, et al., (1999) Corticotropin-releasing factor and the brain-gut motor response to stress. Can J Gastroenterol. 13 Suppl A: 18A-25A.
Takeda E, Terao J, Nakaya Y, et al., (2004) Stress control and human nutrition. J Med Invest, 51:139-145.
Wellman CL (2001) Dendritic reorganization in pyramidal neurons in medial prefrontal cortex after chronic corticosterone administration. J Neurobiol. 49:245-253.
Wittert GA, Livesey JH, Espiner EA, et al., (1996) Adaptation of the hypothalamopituitary adrenal axis to chronic exercise stress in humans. Med Sci Sports Exerc, 28:1015-1019.
Wittstein IS, Thiemann DR, Lima JA, et al., (2005) Neurohumoral features of myocardial stunning due to sudden emotional stress. N Engl J Med. 352:539-548.
Yvonne M, Ulrich-Lai (2006) Chronic stress induces adrenal hyperplasia and hypertrophy in a sub region-specific manner. The American Journal of Physiology – Endocrinology and Metabolism. 291:E965-E973.